


Discover 5 essential statistics to analyze your business data
Discover the new essential statistics to analyze your sales data in your CRM.
Your statistics are enhanced with 5 new charts available.
📈 The power of statistics for a successful commercial strategy
Analyzing your business data is essential to guide your actions and manage your business effectively. Webmecanik Pipeline is constantly evolving to improve your user experience and provide you with an efficient CRM management tool.
In addition to a complete view of your performance, you can now identify new trends to help you make better decisions.
What are the new statistics I can track?
In total, 5 new charts have been implemented: Sales performance, Opportunities progression, Sales activities evaluation, Activities shares and Estimated earnings. These charts come with filters that allow for an even finer analysis of your data: select the period (3, 6, or 12 months) or the owner to obtain even more precise results.
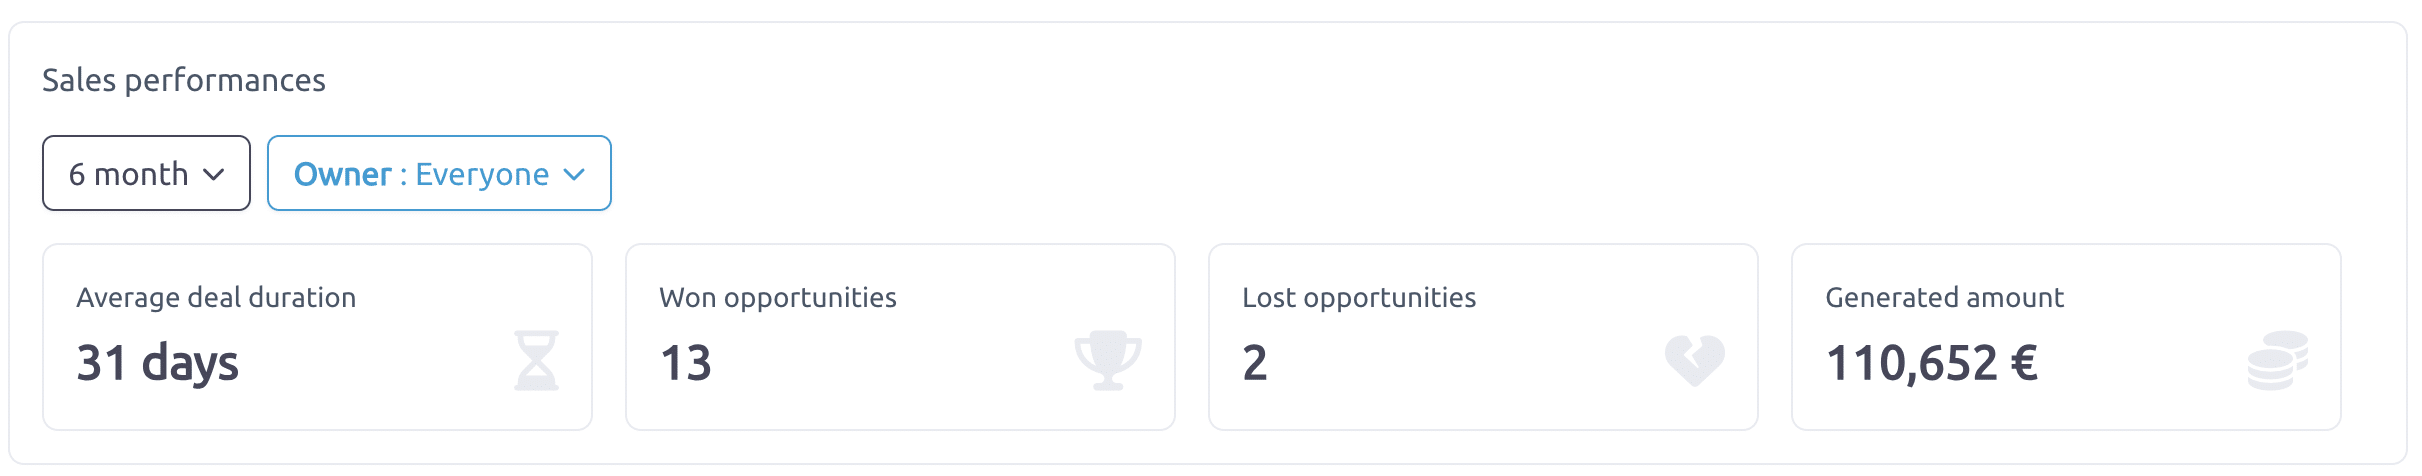
Sales performance
The first chart of Sales performance offers a quick and clear view of the average duration of deals. It helps you easily understand the duration of your sales cycle.
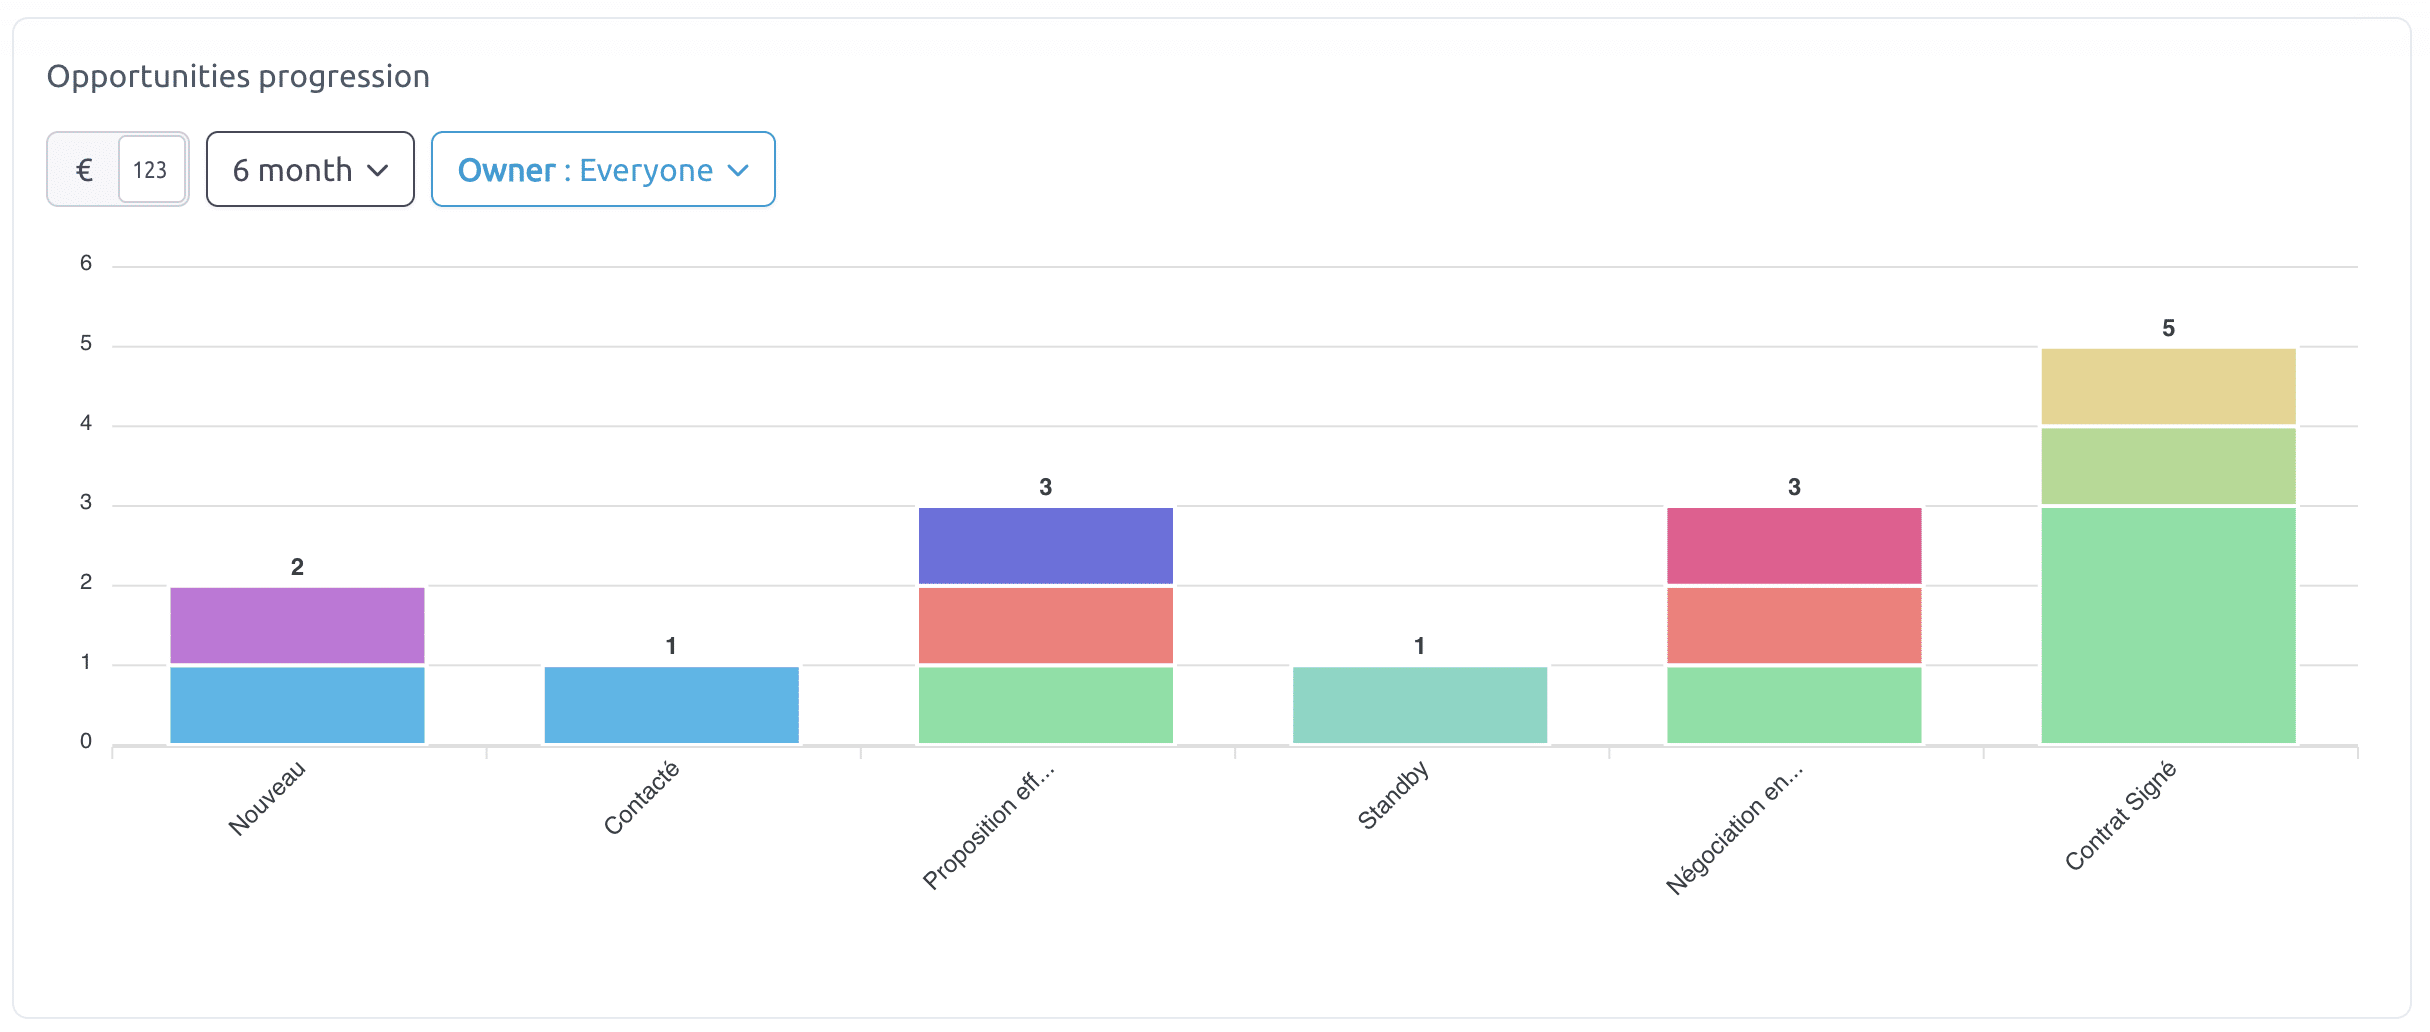
Opportunities progression
Imagine being able to examine your sales funnel at a glance. With this chart, quickly explore the amounts or the number of your opportunities, categorized according to their customizable status.
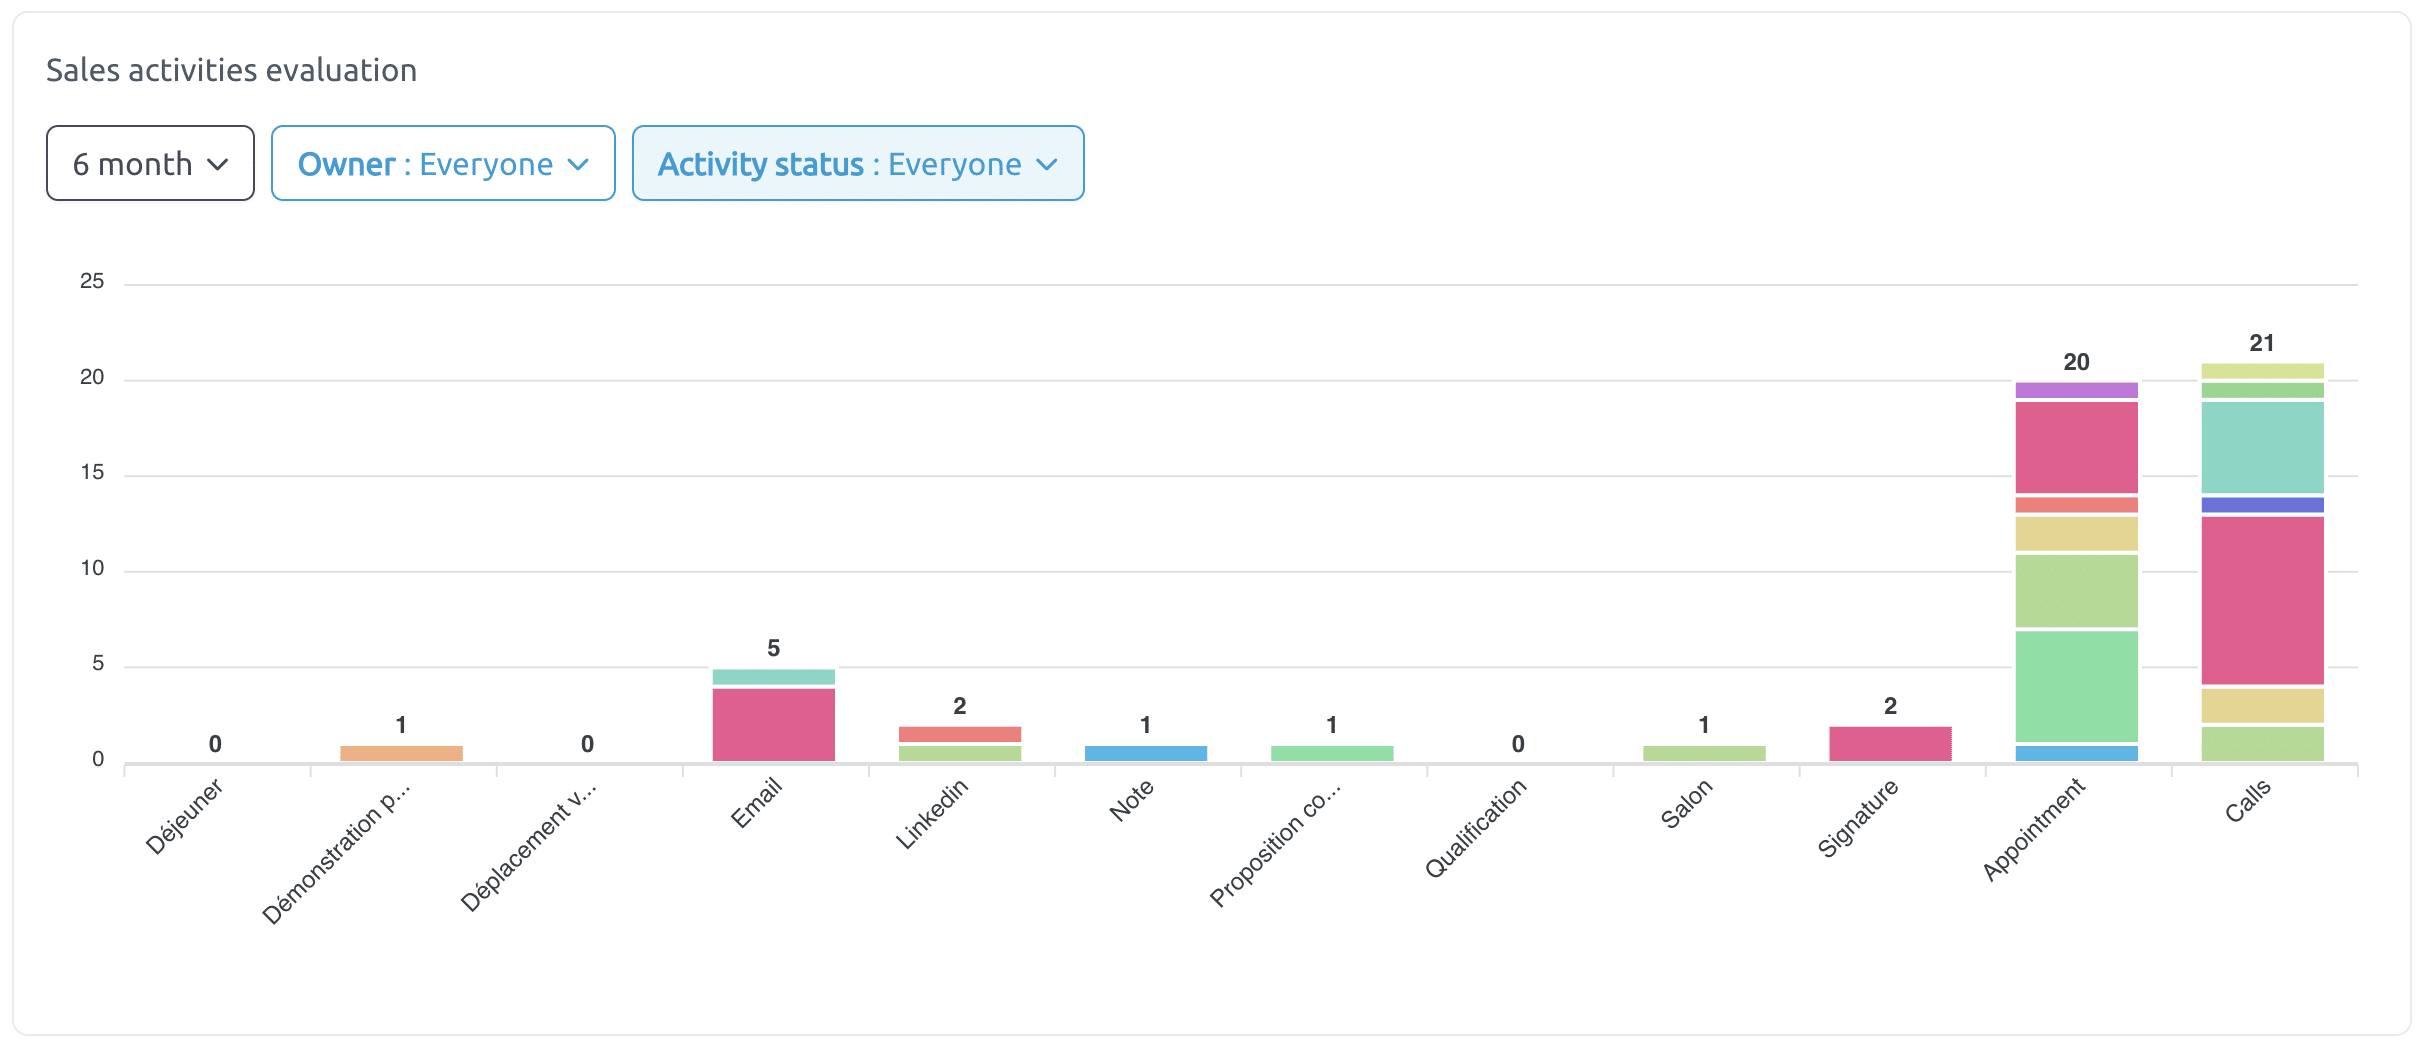
Sales activities evaluation
Understanding how tasks are distributed across your sales teams is crucial to getting a complete view of your various activities. This not only allows you to better support your salespeople, but also to refine your strategy and improve decision-making.
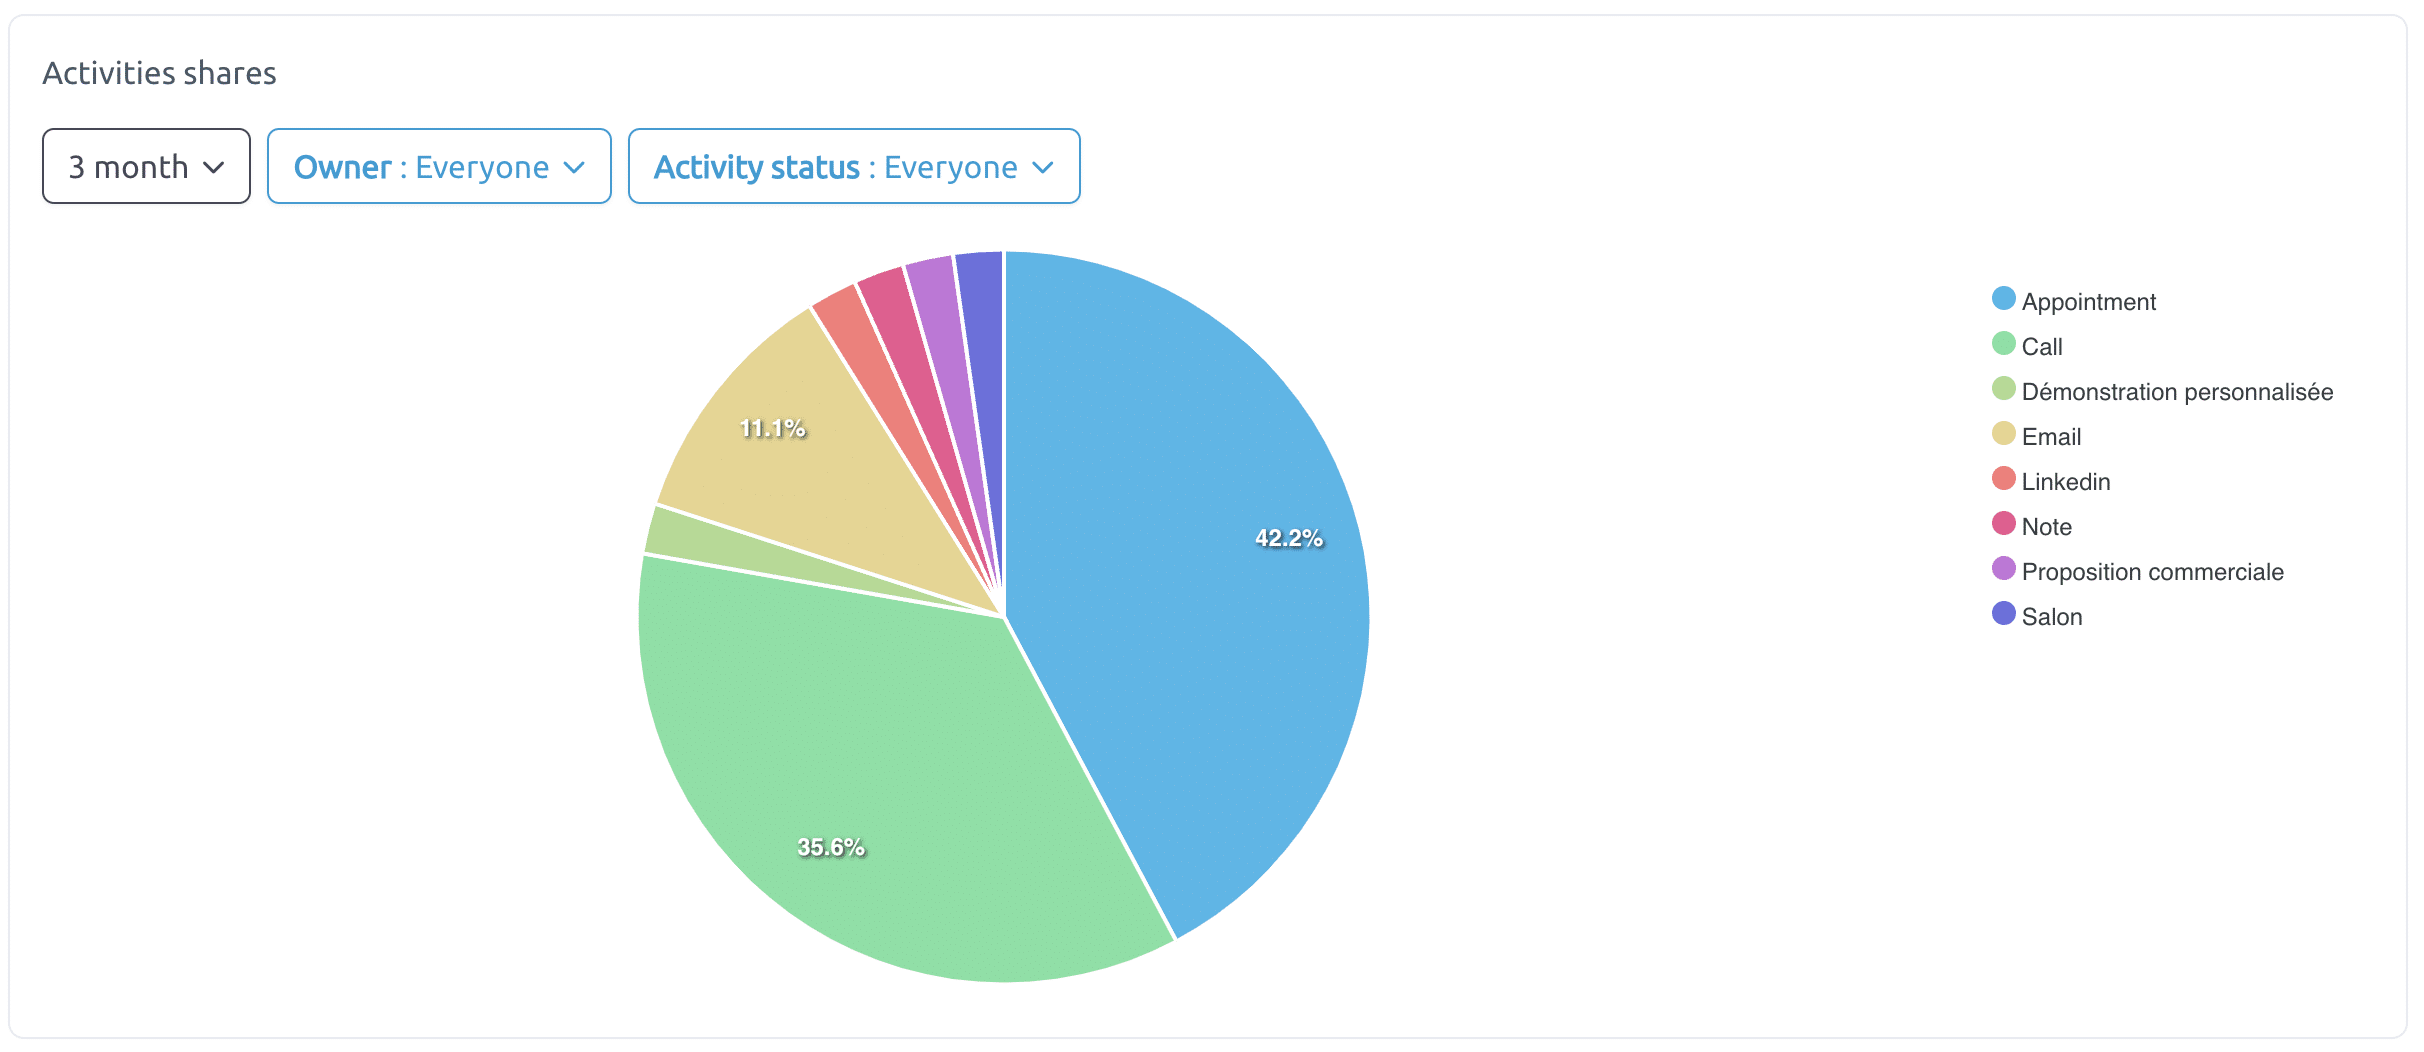
Activities shares
The analysis of activity distribution provides significant insight, not only by breaking down tasks into percentages but also by evaluating their progress: whether they are delayed, scheduled for the future, or already completed.
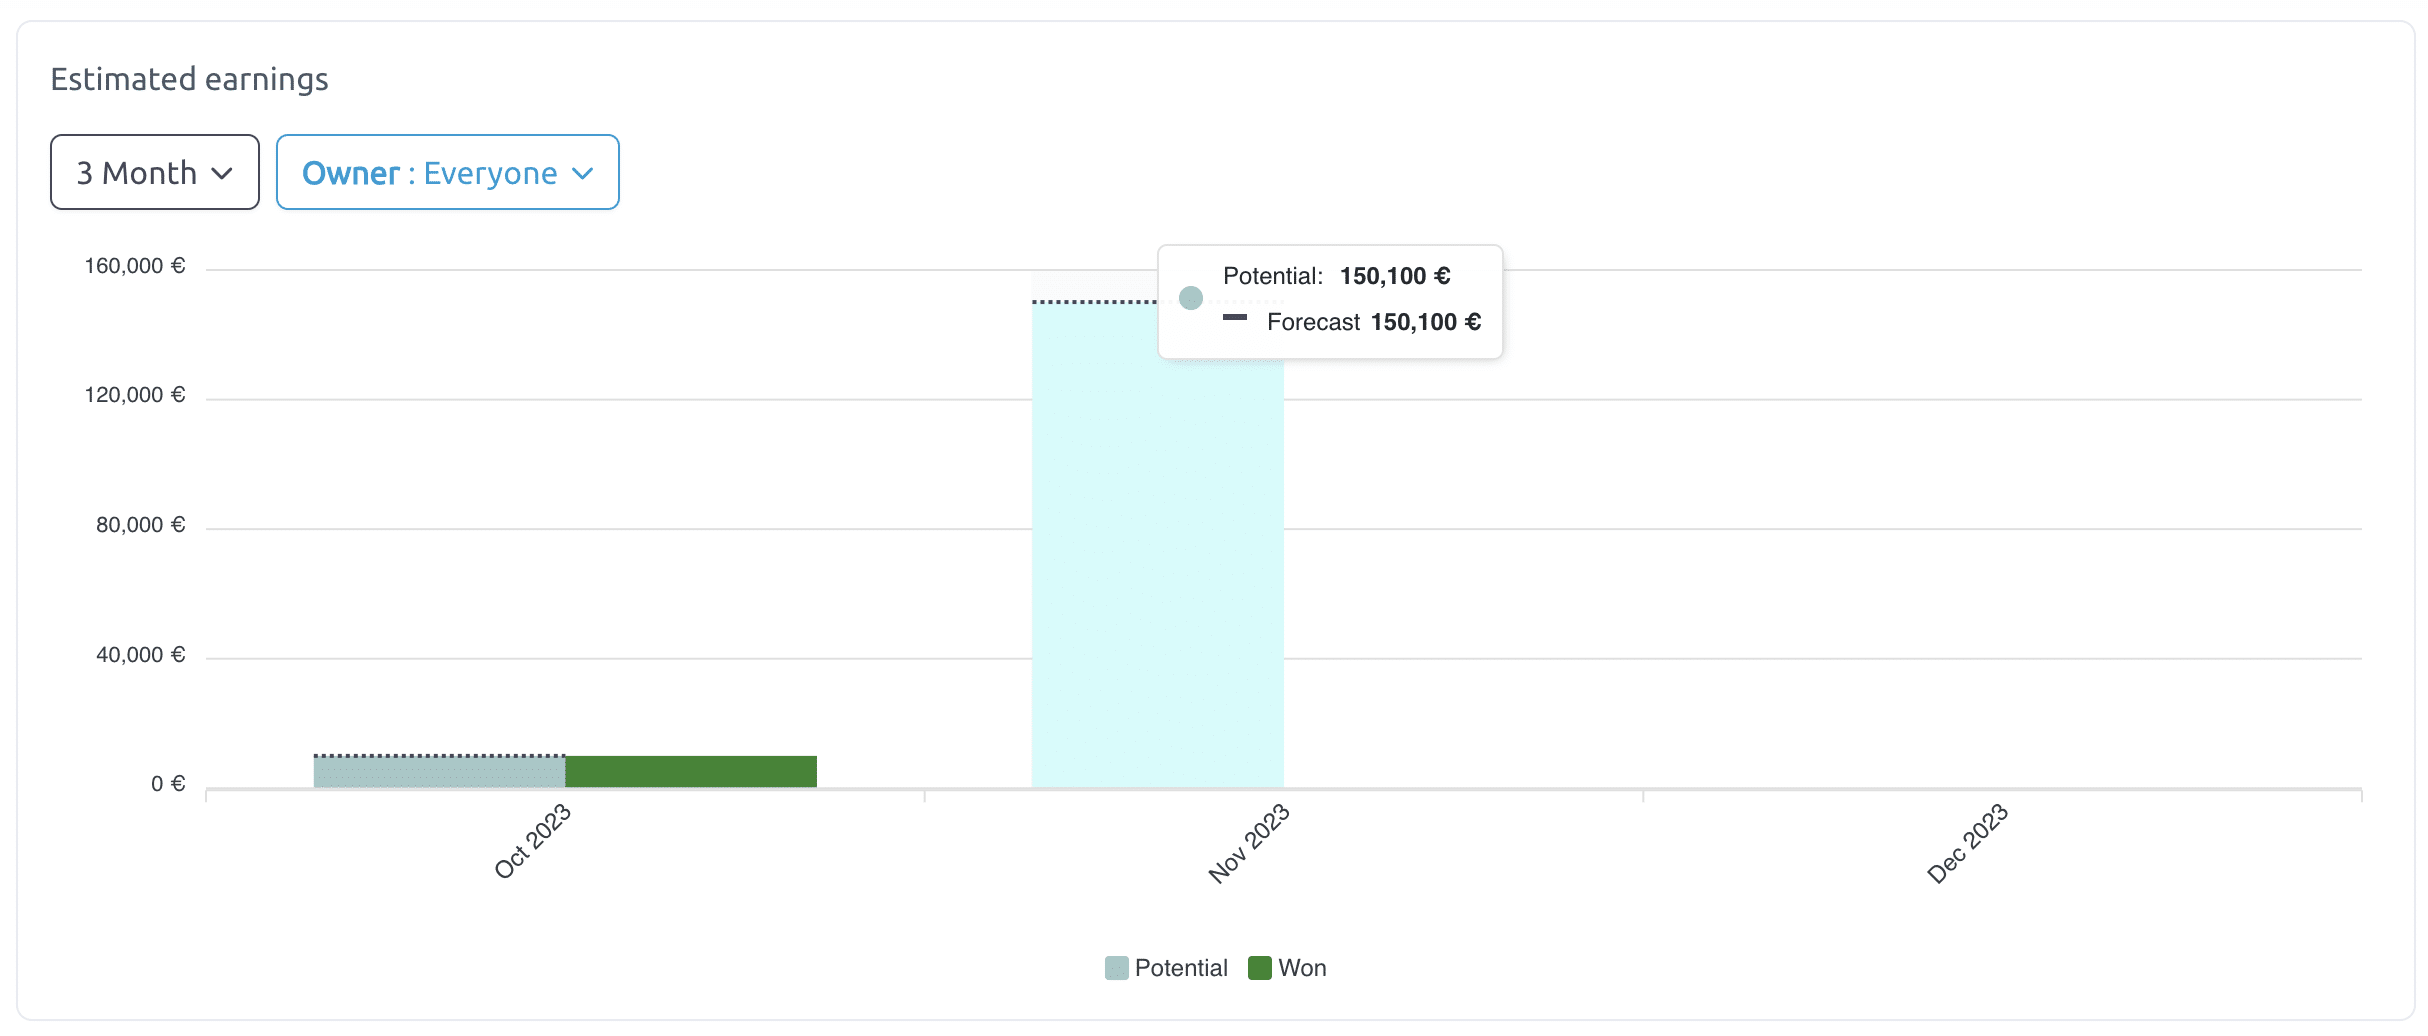
Estimated earnings
This new chart of forecasted gains is designed to make it easier to anticipate the revenue generated by future opportunities. It is particularly useful for accurately assessing the commercial potential in the coming months.
Conclusion
As you can see, with Webmecanik Pipeline, you have the dedicated resources to analyze your commercial performance and guide your decisions wisely. These analyses are extremely valuable for identifying current trends, refining your processes, understanding the nuances of your sales cycle, and reviewing past actions.
